Anyone who has ever "improved" a finished program knows the feeling. You tweak a few cutting conditions, maybe swap a tool, shorten a rapid move — and the program runs. Faster? Maybe. By how much? That's a question for guesswork at the coffee machine, or in the worst case a stopwatch in hand and a spreadsheet you have to build yourself.
MultiPath CNC Editor has the answer built right into the simulator — and along with it a second, related question: what does the part actually cost when you factor in not just inserts, but operator time, material, and energy.
Optimize Mode — before and after comparison
Optimize Mode activates automatically the moment you load two programs at once — the original into channel K1 and the modified/optimized version into K2. The simulator then stops describing the channels as "left" and "right spindle" and starts calling them "Original" and "Optimized". At the same time, the Optimize Report and the Cost / Tool Life columns in the Setup Sheet are unlocked.
The principle is simple: you see both versions of the program side by side, visually in the 2D simulation and in the numbers that back it all up.
What the Optimize Report shows you
At the top are two cards that answer the first question without you having to calculate anything:
Cycle time — original time, optimized time, the difference in minutes and seconds, and percentage savings, colored green for improvement and red if it went the other way.
Cost per part — same logic, just with cost instead of time. This card only fills in when you have insert data entered in the Setup Sheet (more below). Until then, the program reminds you.
Below the cards is a tool-by-tool table — every T-code that appears in at least one version, with old and new time, old and new cost per part, and status: Added (tool is new only in the optimized version), Removed (no longer used in the optimized version), Changed (tool stayed, cutting conditions changed), or Unchanged.
When you enter a batch size, a batch summary appears — how much machine time and how much money in inserts the entire series costs, per tool and in total, for both versions.
Optional sections — when you need more than numbers
Using the "Sections" button you can add further views:
- Text changelog — a human-readable list of changes per tool, for example "T0101: speed change (1200→1600 rpm); feed change (0.15→0.18 mm/rev)" or "T0303: tool removed". Useful when you need to explain to someone on the shop floor or a manager what actually changed, without reading the whole program.
- Cycle time distribution chart — a bar chart that breaks down time into cutting (G1/G2/G3), rapid traverse (G0), tool change, and other/idle time (G4, waiting for M-codes) — original and optimized side by side. You see exactly where those seconds were actually saved — whether it was from cutting or just shorter rapid moves.
- Energy saving estimate — you enter the machine's power draw in kW and the program calculates energy consumption per part for both versions and the saving. It's a rough estimate (assumes constant average draw, ignores spindle load), but for comparing "was it worth it energy-wise" it's enough.
- Breakeven analysis — you enter the machine hourly rate in €/hr and the program calculates the total cost per part including machine time. It returns one of three verdicts: the optimization is cheaper from the very first part; it will never pay off (more expensive inserts not compensated by the time saving); or it pays off after N parts. This is exactly the answer that most people calculate with a pencil on paper today, if at all.
The entire report can be exported to Excel (with all active sections) or printed/saved as PDF, landscape or portrait.
See it in action:
Setup Sheet in Optimize Mode
When Optimize Mode is active, the Setup Sheet shows two separate tool tables — Original (cyan) and Optimized (orange) — and unlocks the Cost / Tool Life columns that power all cost calculations in the report:
- Edges per insert — how many cutting edges one insert has
- Insert price — in euros
- Tool life — how many parts (or minutes) one edge lasts
- Estimated cost per part — calculated automatically: insert price / (edges × tool life)
You fill in these values separately for each tool in each version, so the comparison is genuinely precise — not an eyeball estimate.
Cost Analysis Mode — what the part actually costs
Optimize Mode needs two versions of a program. Cost Analysis Mode does not — it works with whatever is currently loaded, single-channel or dual-channel. The question it answers is different: not "was it worth reworking", but "what does this part actually cost me" — including tools, operator, material, and energy.
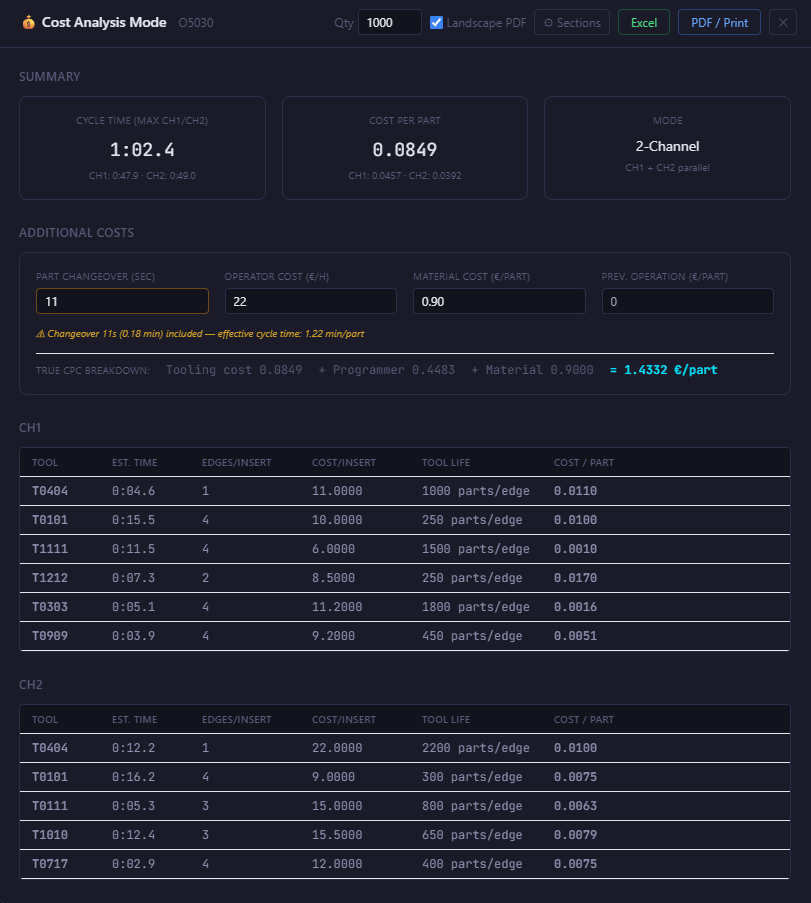
Summary header and per-tool costs
The report starts with the simulated cycle time and cost per part from inserts. For dual-channel programs, the time is correctly calculated with synchronization — accounting for M-code barriers where both channels run in parallel between barriers, and the faster channel waits for the slower one at each barrier. You see the actual machine time, not the sum of two channels, which would be unnecessarily pessimistic.
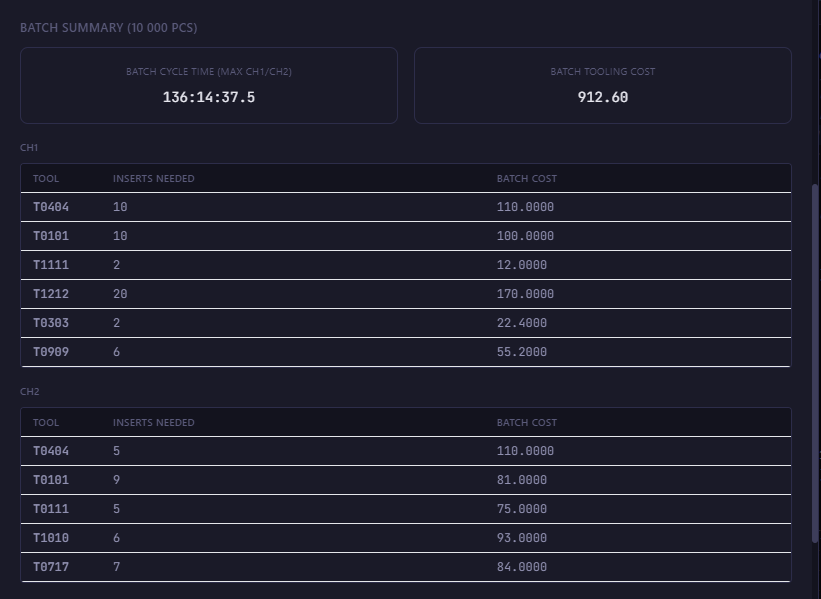
Below is the per-tool cost table — time and cost per part for each T-code, with two channels shown separately for K1 and K2. And just like in Optimize Mode, entering a batch size gives you a series summary — machine time, insert costs, number of edges needed.
Additional Costs — this is what makes Cost Analysis Mode different
This is the main difference from Optimize Mode: Cost Analysis Mode doesn't just count inserts, but the real costs of producing the part:
- Operator rate (€/hr) — multiplied by the effective cycle time (machining + part changeover)
- Material cost per part
- Previous operation cost per part — for example the cost of turning before milling
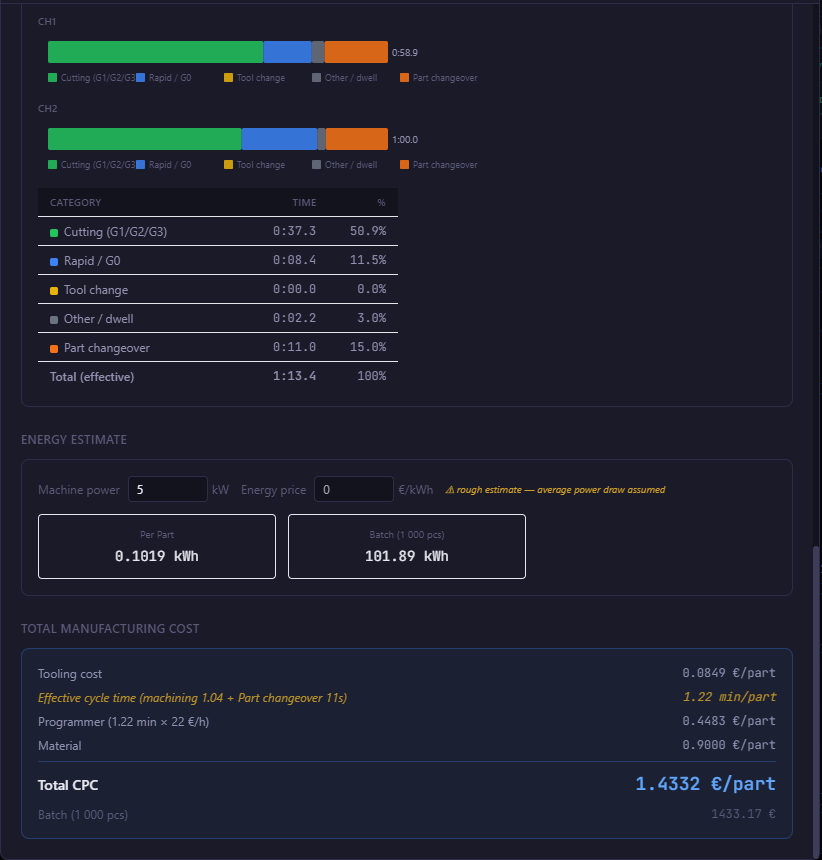
- Energy cost (€/kWh) — converts the estimated consumption to real money
- Part changeover time (in seconds) — time between parts (unload, load, clamp), added to the cycle time when calculating operator and energy costs
These inputs are saved automatically and remain filled in after closing the window or switching between modes — you don't have to re-enter them every time.
When you enter even one of these costs, a Total production costs summary appears, which adds up insert costs, operator, material, previous operation, and energy into one number per part — and for an entered batch size, into the total for the whole series.
The same cycle time distribution chart from Optimize Mode is available here too, for one program (or separately for K1/K2) — and if you have a changeover time entered, an orange segment representing it appears in the chart.
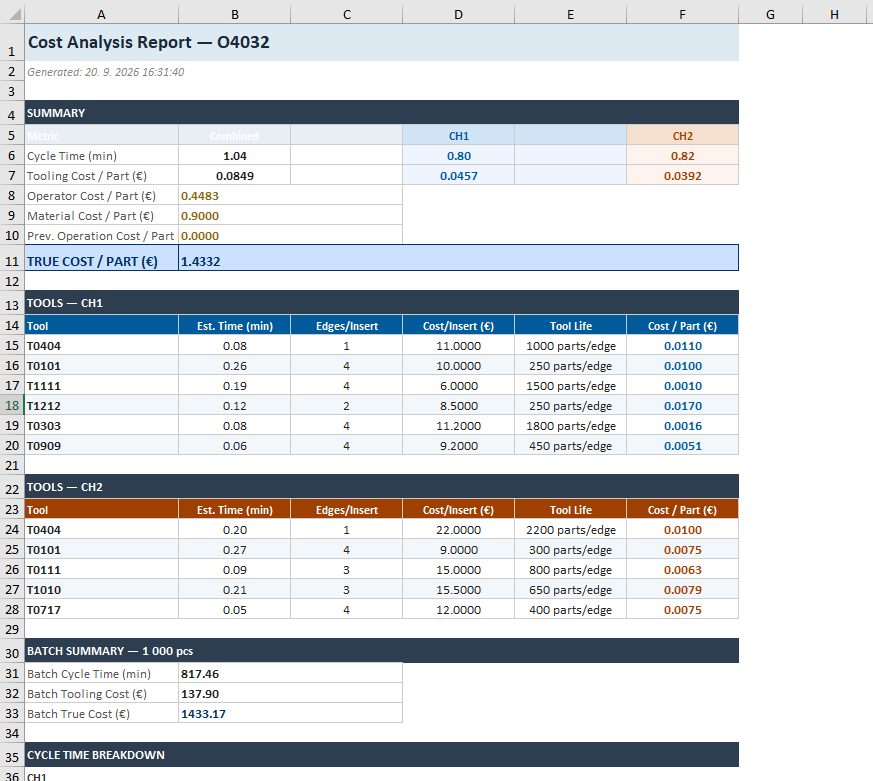
The report likewise exports to Excel or PDF for printing.
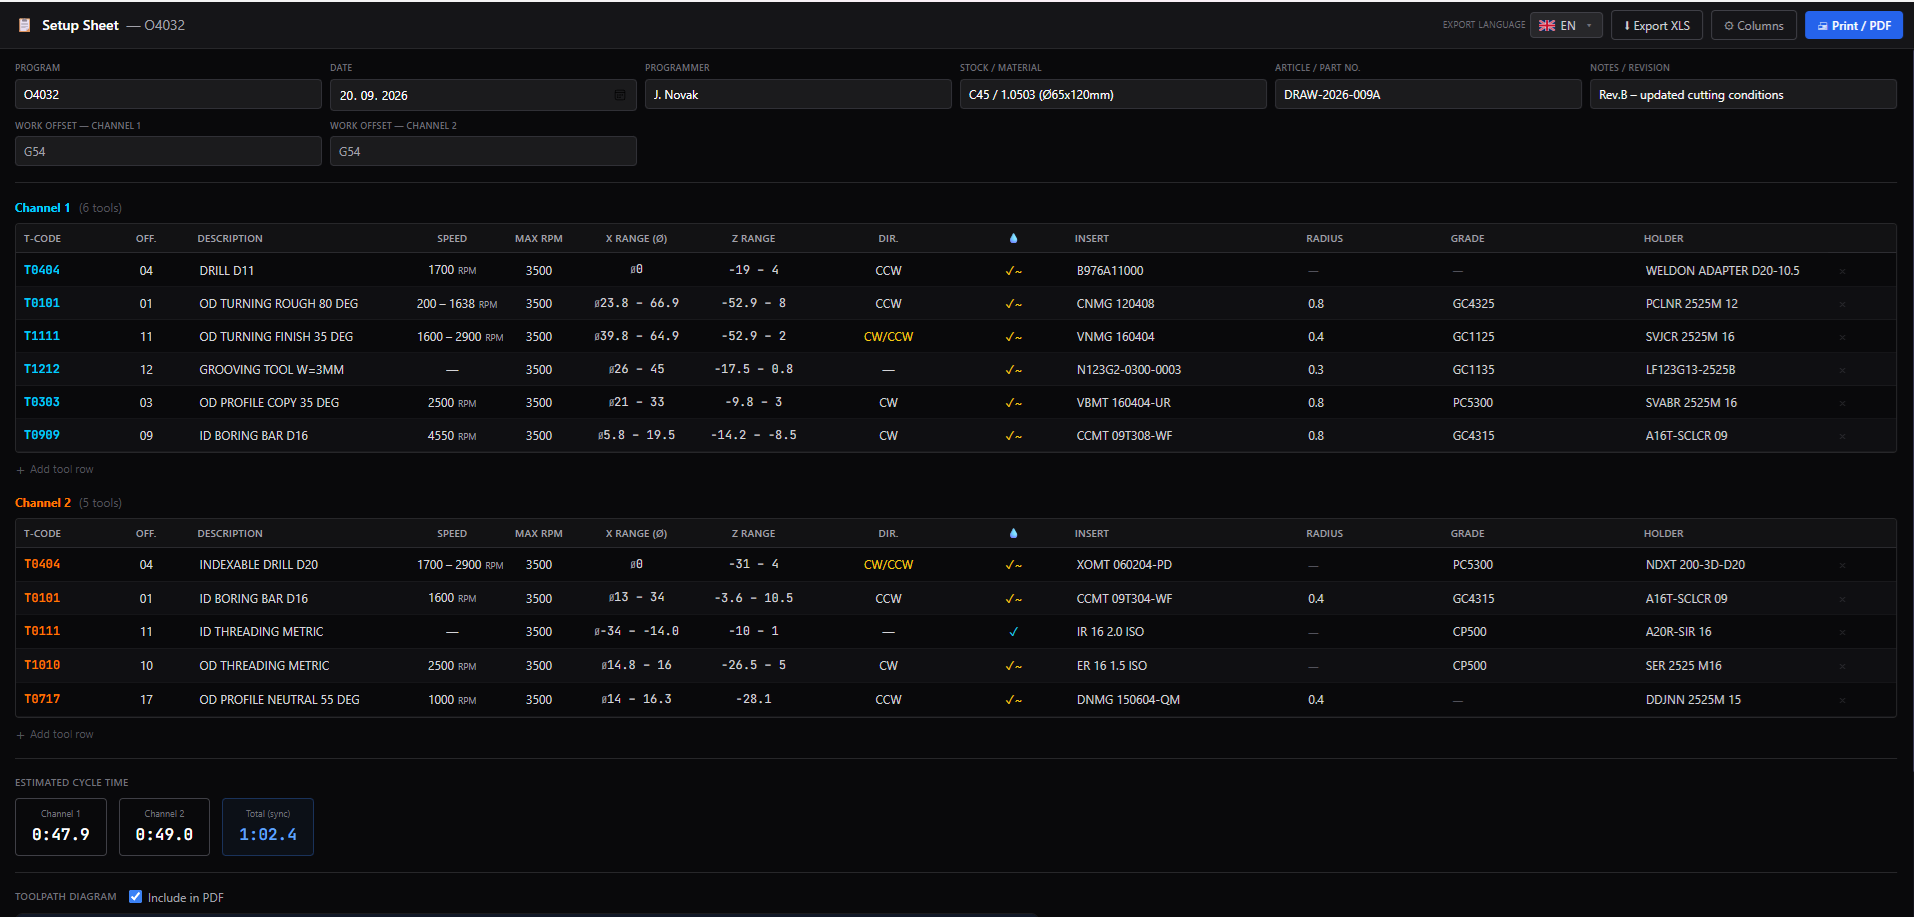
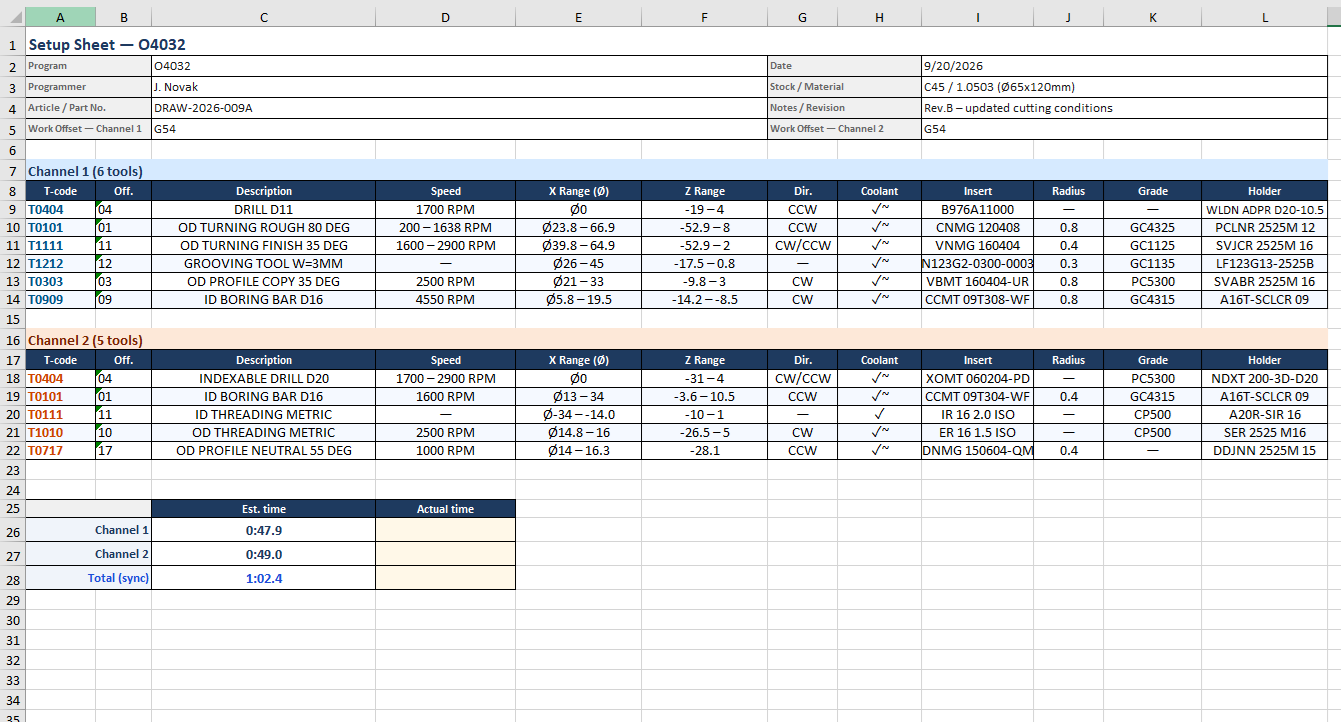
Setup Sheet — shared data source for both modes
Both modes draw from the same place: the Cost / Tool Life columns in the Setup Sheet, which are hidden by default and appear only in Optimize Mode or Cost Analysis Mode.
Entered values and any custom edits to tool descriptions (description, holder, insert ID, note, coolant) are saved and survive mode switching and program restarts.
When to use which
| Optimize Mode | Cost Analysis Mode | |
|---|---|---|
| Programs needed | 2 (original + optimized) | 1 (or 2 for dual-channel programs) |
| Answers the question | Did the optimization pay off? | What does this part cost? |
| Operator / material costs | no (inserts only) | yes (full production costs) |
| Part changeover time | no | yes |
| Breakeven analysis | yes | no |
| Text changelog | yes | no |
| Dual-channel synchronization | no (compares one channel) | yes |
In short: when you're asking "should I rework this program or is it wasted effort", reach for Optimize Mode. When someone asks you "what does a part cost when you factor everything in" — that's what Cost Analysis Mode is for.